
Overview
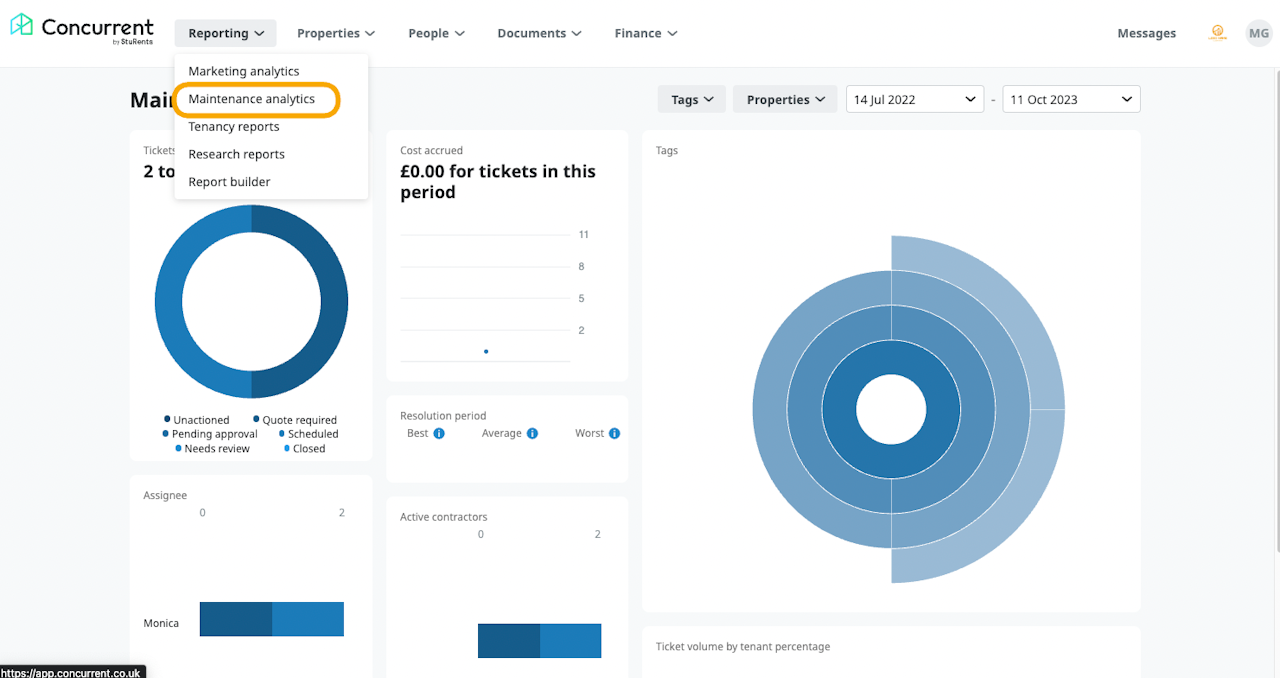
The Maintenance Analytics page allows you to see an overview of maintenance tickets that you have received and raised.
Use the filters for insights based on:
Tags used
The property address
Date range
There are seven charts which include:
Ticket status
Cost accrued
Tags
Assignee
Active contractors
Resolution period
Ticket volume by tenant percentage

Ticket status
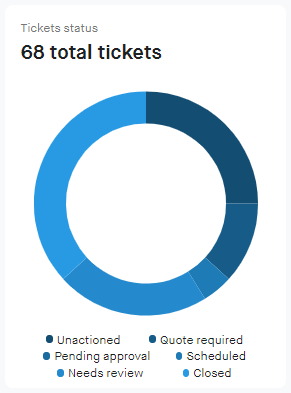
The ticket status chart shows:
The total number of maintenance tickets for the selected period and any filters applied
The status that the tickets are currently in
A key of the statuses included:
Unactioned.
Quote required.
Pending approval.
Scheduled.
Needs review.
Closed.
To see the number of tickets for each status, hover over the segment.

Cost accrued
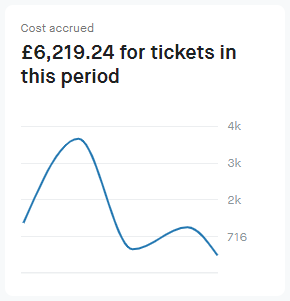
The Cost accrued graph shows:
The cost they have accrued for the selected period and any filters applied.
The total figure is a sum of all invoice amounts (inc VAT).

Tags
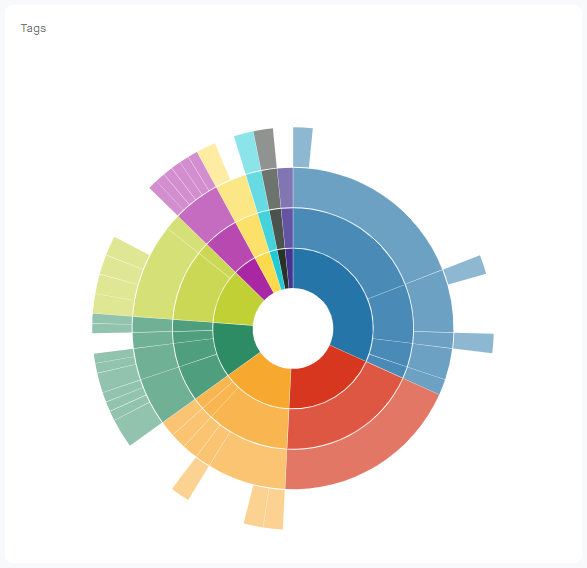
The Tags chart shows from the inside ring out:
Level 1 - All the contractors assigned to tickets.
Level 2 - What status the contractor's tickets are in.
Level 3 - The property addresses that the tickets have been raised for.
Level 4 - The tags that have been added to the tickets.
The chart reflects the selected period and any filters applied.
To see the number of tickets, hover over the segment.

Assignee
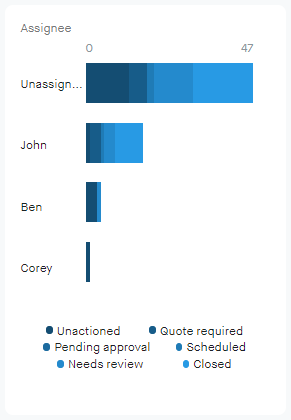
The Assignee chart shows:
The number of tickets assigned to users on your account what status the tickets are currently in for the selected period and any filters applied.
The list is ordered by the number of tickets assigned
A key of the statuses included:
Un-actioned.
Quote required.
Pending approval.
Scheduled.
Needs review.
Closed.
To see the number of tickets for each status, hover over the segment.

Active contractors
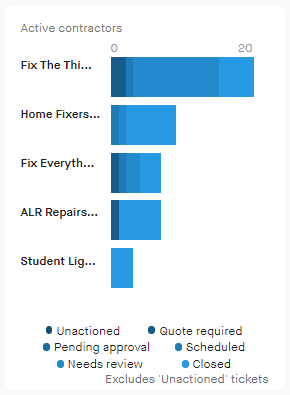
The Active contractors chart shows:
All the contractors that have tickets assigned to them and what status the tickets are currently in for the selected period and any filters applied.
The list is ordered by the number of tickets assigned.
A key of the statuses included:
Un-actioned.
Quote required.
Pending approval.
Scheduled.
Needs review.
Closed.
To see the number of tickets for each status, hover over the segment.

Resolution period
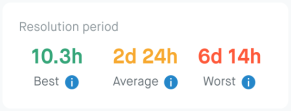
The Resolution period chart shows:
Three statistics on the Best, Average, and Worst ticket resolution times for the selected period.
A tooltip for each that shows additional details about the ticket when you hover over it.

Ticket volume by tenant percentage
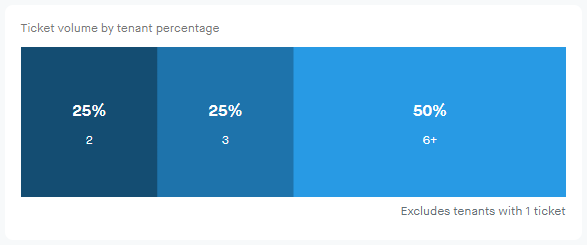
The Ticket volume chart shows:
The percentage of tenants that have X number of tickets open for the selected period and any filters applied
Tenants with only 1 ticket are not shown
To view the tenants, click on a segment on the chart.
